-
Country Pages
-
Asia & the Pacific
- Afghanistan
- Bangladesh
- Bhutan
- Cambodia
- China
- India
- Indonesia
- Iran, Islamic Republic of
- Lao People's Democratic Republic
- Malaysia
- Maldives
- Mongolia
- Myanmar
- Nepal
- Pakistan
- Papua New Guinea
- Philippines
- Sri Lanka
- Thailand
- Timor-Leste
- Viet Nam
-
Eastern Europe & Central Asia
- Albania
- Armenia
- Azerbaijan
- Belarus
- Bosnia and Herzegovina
- Georgia
- Kazakhstan
- Kosovo Office
- Kyrgyzstan
- Moldova, Republic of
- North Macedonia
- Serbia
- Tajikistan
- Türkiye
- Turkmenistan
- Ukraine
- Uzbekistan
-
Arab States
- Algeria
- Djibouti
- Egypt
- Iraq
- Jordan
- Lebanon
- Libya
- Morocco
- Oman
- Palestine
- Somalia
- Sudan
- Syrian Arab Republic
- Tunisia
- Yemen
-
East & Southern Africa
- Angola
- Botswana
- Burundi
- Comoros
- Congo, the Democratic Republic of the
- Eritrea
- Eswatini
- Ethiopia
- Kenya
- Lesotho
- Madagascar
- Malawi
- Mauritius
- Mozambique
- Namibia
- Rwanda
- Seychelles
- South Africa
- South Sudan
- Tanzania, United Republic of
- Uganda
- Zambia
- Zimbabwe
-
Latin America & the Caribbean
- Argentina
- Bolivia, Plurinational State of
- Brazil
- Chile
- Colombia
- Costa Rica
- Cuba
- Dominican Republic
- Ecuador
- El Salvador
- Guatemala
- Haiti
- Honduras
- Mexico
- Nicaragua
- Panama
- Paraguay
- Peru
- Uruguay
- Venezuela, Bolivarian Republic of
- Caribbean (multi-country)
-
West & Central Africa
- Benin
- Burkina Faso
- Cabo Verde
- Cameroon
- Central African Republic
- Chad
- Congo
- Côte d'Ivoire
- Equatorial Guinea
- Gabon
- Gambia
- Ghana
- Guinea
- Guinea-Bissau
- Liberia
- Mali
- Mauritania
- Niger
- Nigeria
- Sao Tome and Principe
- Senegal
- Sierra Leone
- Togo
-
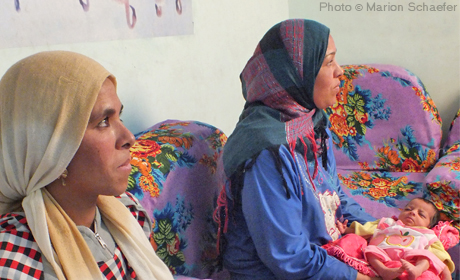
UNFPA Egypt
Through effective policies and programmes, Egypt has made important progress in ensuring widespread access to reproductive health services and reducing maternal deaths. Challenges remain, such as stagnating contraceptive prevalence, female genital mutilation/cutting, and maternal mortality rates. Since 1972, UNFPA has helped the national family planning and population programme overcome initial opposition and become a success. Today, UNFPA supports continued improvements, advocating for integrating reproductive care in primary health services, with full respect for reproductive rights. Programmes also focus on improving maternal health and reducing gender-based violence.
Population
 Population aged 0-14
 Population aged 15-64
 Population aged 65+
Sexual and reproductive health
 Births attended by skilled health personnel
Family Planning
 Modern method
Education
Gender, Rights, and Human Capital
Harmful Practices
Population Pyramid
Life Expectancy
Total fertility rate
News

When health workers harm: the medicalization of female genital mutilation in Egypt
“About 75 per cent of female genital mutilation in the country is performed by doctors,” said Dr. Ayman Sadek, an…

“Your voice is your weapon”: Taking on sexual harassment in Egypt
“Your fear is controlling you,” instructor Amany Abdel-Aal told a roomful of women at a Wen-Do self-defence class, held…
Social Updates
Tweets from UNFPATürkiye